Invest in Smallcaps at Throw Away Prices
Get Recommendation of
2 Smallcap Stocks
Every Week
Subscribe NowTHIS 2 MINUTES VIDEO ON 'HOW IT WORKS?' HAS CHANGED THE INVESTING STYLE OF MANY

Get Recommendation of
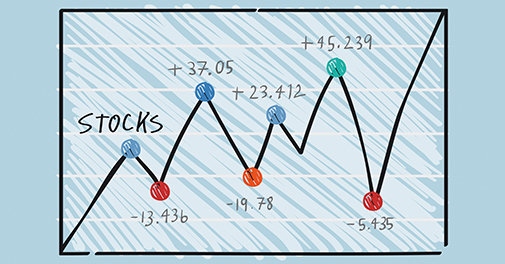
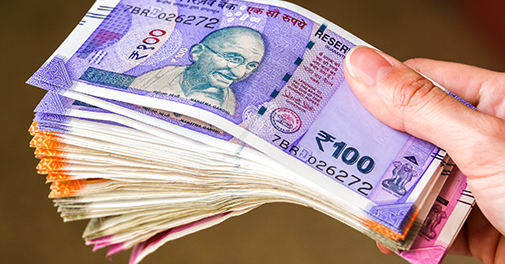
Recommended a company operating in a sector where everyday utility, brand preference, and widespread consumer adoption can support long-term growth.
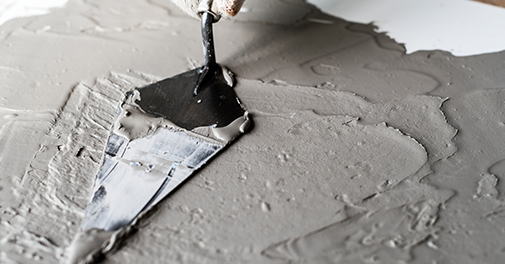
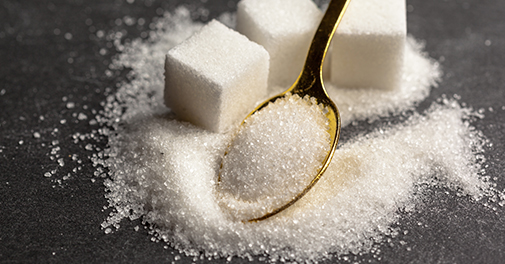
Recommended a company operating in an industry whose products form an important part of multiple downstream manufacturing value chains.
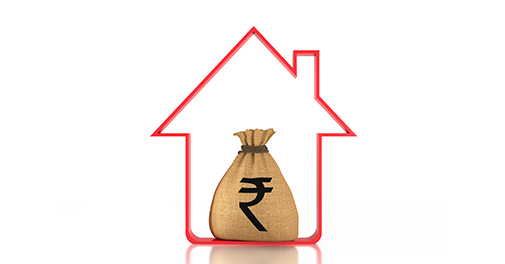
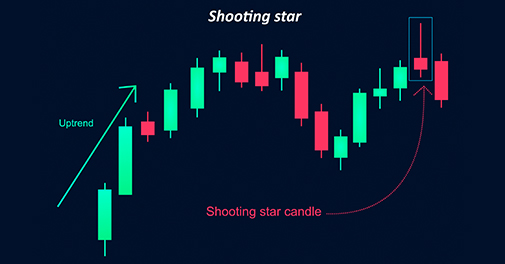
Recommended a company positioned to benefit from structural trends linked to urbanisation, infrastructure creation, and improving standards of living.
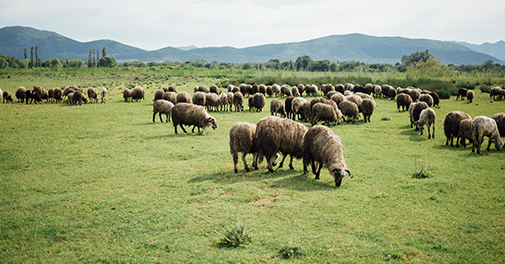
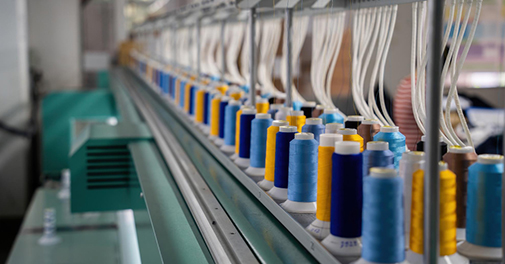
Recommended a company operating in an industry that supports long-term economic development through its role in creating essential assets.


10paisa.com is primarily focused on research of Quality Smallcap Stocks. We provide in-depth research to our subscribers through our website, delivering well-researched stock recommendations based on a structured process.
Through detailed analysis, we aim to identify smallcap stocks with sound fundamentals and a favourable risk–reward profile, focusing on opportunities supported by thorough research.
NO FUTURES, NO OPTIONS, NO INTRADAY TRADING.
EXCLUSIVE & FOCUSED SERVICE I.E. RECOMMENDATION OF 2 SMALLCAP STOCKS WITH ANALYSIS REPORTS WEEKLY.
IN OUR RECOMMENDATION SERVICE, YOU INVEST WISELY AND BOOK PROFITS WHENEVER ANY STOCK REACHES ITS TARGET.
GET LOGIN DETAILS AFTER SUBSCRIPTION AND SEE LATEST UPDATED 2 MIDCAP STOCKS TOO.
Midcaps.in : Specialises in Research of Midcap Stocks. Recommendation of 2 Midcap Stocks Every Week.
SmallStocks.in : Specialises in Research of Quality Stocks Upto Rs. 100. Recommendation of 2 Stocks Every Week having Price Upto Rs.100.
MidtoMega.com : Specialises in Research of those Quality Stocks which may be in transition of being Mega Caps in future. Recommendation of 2 Stocks Monthly.
Largecaps.in : Specialises in research of Largecap stocks. Recommendation of 1 Largecap Stock every week.
10paisa.com is a website for prudent investors… for people who wish to make their hard earned money increase in value through intelligent investing. By researching over hundreds of shares of the Indian stock market, 10paisa.com chooses only such worthwhile gems that are most likely to earn good money for investors.
After a careful study and analysis, we recommend two potentially first-rate stocks with analysis reports every week wherein investments could help our subscribers make profits when the recommended stocks achieve their target value.
We don’t recommend stocks in futures & options or intraday trading as we do not want any subscriber to lose even one rupee by way of speculation. Working round the clock, our research analysts labour hard to pick good quality stocks as per their fundamentals, available at reasonable prices as well as good risk-reward ratio.
By availing our newsletters, subscribers get recommendation of 2 Stocks every week i.e. 1 Smallcap Stock on Wednesday and 1 Smallcap Stock on Saturday along with Analysis Report about the Company’s financial well being and market prospects as well the target price of the stock.
Equity investing is a great option to build your wealth, but the art of finding great Businesses at reasonable Valuations only comes with the time spent in the Stock Market. 10paisa.com is a Tested, Trusted & Admired Website Since 2004.
10paisa.com always tries to give more value in less consideration to its Subscribers. So, we provide Discounts & Offers time to time.
We do thorough Research & Analysis on Fundamentals of companies like Balance Sheet, Profit & Loss Account, Key Financial Ratios (ROE,ROCE, Debt to Equity etc.), Quarterly, Half-yearly & Annual Results, Cash Flows, Annual Reports, Shareholding Pattern etc.
We don't depend on numbers only. We also do in-depth research of each company's Business Model, Future Projections, Competitive Advantages & other Moats before recommending any Stock.


Available In : English | हिंदी

Available In : English | हिंदी

Available In : English | हिंदी

Available In : English | हिंदी


Parveen K. Sharma

Parveen K. Sharma

Parveen K. Sharma
Parveen K. Sharma

Parveen K. Sharma

Parveen K. Sharma

Parveen K. Sharma

Parveen K. Sharma

Parveen K. Sharma

Parveen K. Sharma
Parveen K. Sharma

Parveen K. Sharma

Parveen K. Sharma

Parveen K. Sharma

Parveen K. Sharma

Parveen K. Sharma

Parveen K. Sharma

Parveen K. Sharma

Parveen K. Sharma

Parveen K. Sharma

Parveen K. Sharma

Parveen K. Sharma

Parveen K. Sharma

Parveen K. Sharma
Parveen K. Sharma

Parveen K. Sharma

Parveen K. Sharma

Parveen K. Sharma

Parveen K. Sharma

Parveen K. Sharma

Parveen K. Sharma

Parveen K. Sharma

Parveen K. Sharma

Parveen K. Sharma

Parveen K. Sharma

Parveen K. Sharma

Parveen K. Sharma

Parveen K. Sharma

Parveen K. Sharma

Parveen K. Sharma

Parveen K. Sharma

Parveen K. Sharma

Parveen K. Sharma

Parveen K. Sharma

Parveen K. Sharma

Parveen K. Sharma

Parveen K. Sharma

Parveen K. Sharma

Parveen K. Sharma

Parveen K. Sharma

Parveen K. Sharma

Parveen K. Sharma

Parveen K. Sharma

Parveen K. Sharma

Parveen K. Sharma

Parveen K. Sharma

Parveen K. Sharma

Parveen K. Sharma

Parveen K. Sharma

Parveen K. Sharma

Parveen K. Sharma

Parveen K. Sharma

Parveen K. Sharma

Parveen K. Sharma

Parveen K. Sharma

Parveen K. Sharma

Parveen K. Sharma
Parveen K. Sharma

Parveen K. Sharma

Parveen K. Sharma

Parveen K. Sharma

Parveen K. Sharma

Parveen K. Sharma

Parveen K. Sharma

Parveen K. Sharma

Parveen K. Sharma

Parveen K. Sharma

Parveen K. Sharma

Parveen K. Sharma

Parveen K. Sharma

Parveen K. Sharma

Parveen K. Sharma

Parveen K. Sharma

Parveen K. Sharma

Parveen K. Sharma

Parveen K. Sharma

Parveen K. Sharma

Parveen K. Sharma

Parveen K. Sharma

Parveen K. Sharma

Parveen K. Sharma

Parveen K. Sharma

Parveen K. Sharma

Parveen K. Sharma

Parveen K. Sharma

Parveen K. Sharma

Parveen K. Sharma

Parveen K. Sharma

Parveen K. Sharma

Parveen K. Sharma

Parveen K. Sharma

Parveen K. Sharma

Parveen K. Sharma

Parveen K. Sharma

Parveen K. Sharma

Parveen K. Sharma

Parveen K. Sharma

Parveen K. Sharma

Parveen K. Sharma

Parveen K. Sharma

Parveen K. Sharma

Parveen K. Sharma

Parveen K. Sharma

Parveen K. Sharma

Parveen K. Sharma

Parveen K. Sharma

Parveen K. Sharma

Parveen K. Sharma

Parveen K. Sharma

Parveen K. Sharma

Parveen K. Sharma
Parveen K. Sharma

Parveen K. Sharma

Parveen K. Sharma

Parveen K. Sharma

Parveen K. Sharma
Parveen K. Sharma

Parveen K. Sharma

Parveen K. Sharma

Parveen K. Sharma

Parveen K. Sharma

Parveen K. Sharma

Parveen K. Sharma

Parveen K. Sharma

Parveen K. Sharma

Parveen K. Sharma

Parveen K. Sharma

Parveen K. Sharma

Parveen K. Sharma

Parveen K. Sharma

Parveen K. Sharma

Parveen K. Sharma

Parveen K. Sharma

Parveen K. Sharma

Parveen K. Sharma
Parveen K. Sharma

Parveen K. Sharma

Parveen K. Sharma

Parveen K. Sharma

Parveen K. Sharma

Parveen K. Sharma

Parveen K. Sharma

Parveen K. Sharma

Parveen K. Sharma

Parveen K. Sharma

Parveen K. Sharma

Parveen K. Sharma

Parveen K. Sharma

Parveen K. Sharma

Parveen K. Sharma

Parveen K. Sharma

Parveen K. Sharma

Parveen K. Sharma

Parveen K. Sharma

Parveen K. Sharma

Parveen K. Sharma

Parveen K. Sharma

Parveen K. Sharma

Parveen K. Sharma

Parveen K. Sharma

Parveen K. Sharma

Parveen K. Sharma

Parveen K. Sharma

Parveen K. Sharma

Parveen K. Sharma

Parveen K. Sharma

Parveen K. Sharma

Parveen K. Sharma

Parveen K. Sharma

Parveen K. Sharma

Parveen K. Sharma

Parveen K. Sharma

Parveen K. Sharma

Parveen K. Sharma

Parveen K. Sharma

Parveen K. Sharma

Parveen K. Sharma

Parveen K. Sharma

Parveen K. Sharma

Parveen K. Sharma

Parveen K. Sharma

Parveen K. Sharma

Parveen K. Sharma

Parveen K. Sharma

Parveen K. Sharma

Parveen K. Sharma

Parveen K. Sharma

Parveen K. Sharma

Parveen K. Sharma

Parveen K. Sharma

Parveen K. Sharma

Parveen K. Sharma

Parveen K. Sharma
Parveen K. Sharma

Parveen K. Sharma

Parveen K. Sharma

Parveen K. Sharma

Parveen K. Sharma

Parveen K. Sharma

Parveen K. Sharma

Parveen K. Sharma

Parveen K. Sharma

Parveen K. Sharma

Parveen K. Sharma

Parveen K. Sharma

Parveen K. Sharma

Parveen K. Sharma

Parveen K. Sharma

Parveen K. Sharma

Parveen K. Sharma

Parveen K. Sharma

Parveen K. Sharma

Parveen K. Sharma

Parveen K. Sharma

Parveen K. Sharma

Parveen K. Sharma

Parveen K. Sharma

Parveen K. Sharma